Diagnosing Internet Issues, Part Three

This is the third and final installment (for now!) in my brief series on Internet issues. This time we’re addressing throughput, because it’s another one that comes up occasionally.

So here is the scenario, you’ve had a rack of equipment in a datacenter in New York for the last few months, and everything is going well. But you had a brief outage back in 2013 when the hurricane hit, and you’d like to avoid having an issue like that again in the future, so you order some equipment and lease a rack with a datacenter in Los Angeles and set to copying your data across.

Only, you hit a snag. You bought 1Gbps ports at each end, you get pretty close to 1Gbps from speed test servers when you test systems on each end, but when you set about transferring your critical data files you realize you’re only seeing a few Mbps, what gives?!

There are a number of things that can cause low speeds between two systems, it could be the system itself is unable to transmit or receive the data fast enough for some reason, which may indicate a poor network setup (half-duplex, anyone?) or a bad crimp on a cable. It could be that there is congestion on one or more networks between the locations, or in this case, it could simply be due to latency.

Latency, you ask, what difference does it make if the servers are right beside each other or half way around the world?! Chances are you are using a transfer protocol that uses TCP. HTTP does, FTP does, along with others. TCP has many pros compared with UDP, it’s alternative. The most common is that it’s very hard to actually lose data in a TCP transfer, because it’s constantly checking itself. In the event it finds a packet hasn’t been received it will resend it until either the connection times out, or it receives an acknowledgement from the other side.

[notice]A TCP connection is made to a bar, and it says to the barman “I’d like a beer!”

The barman responds “You would like a beer?”

To which the TCP connection says “Yes, I’d like a beer”

The barman pours the beer, gives it to the TCP connection and says “OK, this is your beer.”

The TCP connection responds “This is my beer?”

The barman says “Yes, this is your beer”

and finally the TCP connection, having drunk the beer and enjoyed it, thanks the barman and disconnects.[/notice]

UDP, on the other hand, will send and forget. It doesn’t care whether the other side got the packet it sent, any error checking for services using UDP will need to be built into the system using UDP. It’s entirely possible that UDP packets will arrive out of order, so your protocol will need to take that into account too.

[notice]Knock knock.

Who’s there?

A UDP packet.

A UDP packet who?[/notice]

If you’re worried about losing data, TCP is the way to go. If you want to just send the stream and not worry about whether it gets there in time or in order, UDP is probably the better alternative. File transfers tend to use TCP, voice and video conversations tend to prefer UDP.

But that’s where TCP has it’s problem with latency: the constant checking. When a TCP stream sends a packet, it waits for an acknowledgement before sending the next one. If your server in New York is sending data to another server in Los Angeles, remember our calculation from last week? The absolute best ideal world latency you can hope for is around 40ms, but because we know that fiber doesn’t run in a straight line, and routers and switches on the path are going to slow it down, that’s probably going to be closer to 45 or 50ms. That is, every time you send a window of traffic, your server waits at least 50ms for the acknowledgement before it sends the next one.

The default window size in Debian is 208KB. The default in CentOS is 122KB. To calculate the max throughput, we need the window size in bits, and we divide that by the latency in seconds, so for Debian our max throughput from NY to LA is 212992*8[the window in bytes *8, 1,623,936] divided by 0.045 = 36087466.67bps, that’s 36mbps as a max throughput, not including protocol overhead. For CentOS we get 22209422.22bps, or 22mbps.

So for each stream, you get 22mbps between CentOS servers, when you’re paying for 1Gbps at each end, how can we fix this? There are three ways to resolve the issue:

1) Reduce the latency between locations, that isn’t going to happen because they can’t be moved any closer together (at least, not without the two cities being really unhappy) and we’re limited by physics with regard to how quickly we can transmit data.

2) We can change the default window size in the operating system. That is, we can tell the OS to send bigger windows, that way instead of sending 208KB and waiting for an acknowledgement, we could send 1024KB and wait, or send 4096KB and wait. This has pros and cons. On the plus side, you spend less time per KB waiting for a response, meaning that if the window of data is successfully sent you don’t have to wait so long for the confirmation. The big negative side is that if for some reason any part of the packet is lost or corrupted the entire window will need to be resent, and it has to sit in memory on the sending side until it has been acknowledged as received and complete.

3) We can tell the OS to send more windows of data before it needs to receive an acknowledgement. That is to say that instead of sending just one window and waiting for the ack, we can send 5 windows and wait for those to be acknowledged. We have the same con that the windows need to sit in memory before they are acked, but we are still sending more data before we get the ack, and if one of those windows is lost then it’s a smaller amount of data to be resent.

All in all, you need to decide what is best for your needs and what you are prepared to deal with. Option 1 isn’t really an option, but there are a number of settings you can tweak to make options 2 and 3 balance out for you, and increase that performance.

On the other hand, you could also just perform your data transfer in a way that sends multiple streams of data over the connection and avoid the TCP tweaking issue altogether.

Diagnosing Internet Issues, Part Two

Last week we covered traceroutes, and why you should gather data on both the forward path and the reverse path. This week we are looking at MTR, why you should use it, and how to interpret the results.

‘traceroute’ is a very handy tool, and it exists on most operating systems. If it isn’t there by default, there is almost undoubtedly a package you can install, or at worst, source code available to download and compile for your particular OS. Its one downfall is that it does one task, providing the path. Sometimes that data isn’t enough on its own, you need to see the path over time and observe the situation as it stands with an average view.

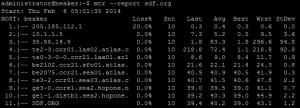
Enter “MTR”, initially “Matt’s Trace Route” and since renamed “My Trace Route” is a tool that has existed for Unix systems for over 17 years. It has several advantages over the traditional traceroute, and is preferred by many because of them. It will run multiple traces sequentially, and provide the results as it goes, telling you what percentage of packets have been lost at any hop, some latency statistics per hop (average response time, worst response time, etc), and in the event the route changes while the trace is in progress it will expand each hop with the list of routers it has seen. MTR is available for most Unix systems via their package managers or by a source download. An MTR clone is available for Windows called WinMTR.

Let’s give a quick overview of how traceroute works. First it sends out an ICMP Echo request, with a TTL of 1. Whenever a request passes through a router it will decrement the TTL by 1 and if/when the TTL on a packet reaches 0, the expectation is that the router will generate an ICMP Type 11 packet in return, or a Time Exceeded. Therefore when traceroute sends the first packet, with a TTL of 1, it expires at the first router it encounters, and the packet that is returned contains enough information that traceroute knows the IP address of the first hop, and it can use a reverse DNS lookup to get a hostname for it. Then it will send out another ICMP Echo request with a TTL of 2, this packet will pass through the first hop, where the TTL is decreased to 1, and then expires at the second hop. This carries on until either the maximum TTL is reached (typically 30 by default) or the destination is reached.

mtrex1

In this example, the red line is TTL=1, the green line is TTL=2, the orange line TTL=3 and the blue line TTL=4, where we reach our destination and the trace is complete.

This is where we start to encounter issues, because in the land of hardware routers there is a distinct difference in how the router handles traffic for which the router itself is the destination (e.g. traffic TO the router) and how it handles traffic for other destinations (traffic THROUGH the router). In our example above, the router at the first hop needs to receive, process, and return the packet to the origin. However, the other three packets it doesn’t need to look at, it only needs pass them on. From a hardware perspective they are handled by two entirely different parts of the router.

Cisco routers, and the other hardware vendors, typically have grossly underpowered processors for performing compute tasks, most under the 2GHz mark and many older routers still in production environments are under 1GHz CPUs. Despite the low clock speed, they remain fast by using hardware. Unfiltered traffic which only passes through the router is handled by the forwarding or data planes. These are updated as required by the control plane, but beyond that they are able to just sit back and transfer packets like it was their purpose (hint: it was their purpose).

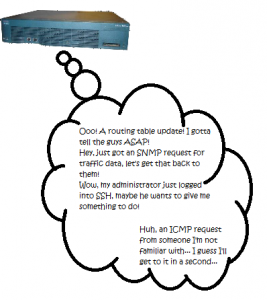
That significantly reduces the load on the CPU, but it will still be busy with any number of tasks from updating the routing tables (any time a BGP session refreshes, the routing table needs to be rebuilt) to processing things like SNMP requests to allowing administrators to log in via Telnet, SSH or the serial console and run commands. Included in that list is processing ICMP requests directed to the router itself (remember, ICMP packets passing through the router aren’t counted).

mtrex2

To prevent abuse, most routers have a Control Plane Policy in place to limit different kinds of traffic. BGP updates from known peers are typically accepted without filter, while BGP packets from unknown neighbors are rejected without question. SNMP requests may need to be rate limited or filtered, but if they’re from a known safe source, such as your monitoring server, they should be allowed through. ICMP packets may be dropped by this policy, or they may just be ratelimited. In any case, they CPU tends to consider them a low priority, so if it has more important tasks to do then they will just sit in the queue until the CPU has time to process them, or they expire.

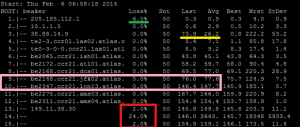
Why is this important? Because they play a large role in interpreting an MTR result, such as the one below:

mtrex3

The first item is the green line. For some reason, we saw a 6% loss of the packets that were sent to our first hop. Remember the difference between traffic TO a router and traffic THROUGH a router. We are seeing 6% of packets being dropped at the first hop, but there is not a “packet loss issue” at this router. All that we are seeing is that the router is, either by policy or by its current load, not responding or not responding in time to our trace requests. If the router itself were dropping packets, we’d see that 6% propagating through the rest of the trace.

The second item is the yellow line, notice how the average response time for this hop is unusually higher compared to those before it? More importantly, notice how the next hop is lower again? This is a further indication that issues you could misinterpret from MTR are not really issues at all. Again, like the green line, all that we see here is that the router at hop 3 is either, by policy or by current process load, too busy to respond as quickly as other hops, so we see a delay in its response. Again, traffic through the router is being passed quickly, but ICMP traffic to the router is being responded to much more slowly.

The pink box is, to me, the most interesting one, and this is getting a little off track. Here we see the traffic go from New York (jfk, the airport code for one of New York’s airports, LGA is another common one for New York devices) to London (lon). There are several fiber links between New York and London, along with some other east coast US cities, but it still takes time for the light to travel between those two cities. The speed of light through a fiber optic cable is somewhere around c/1.46 (where c is the speed of light in a vacuum, or 300,000km/s and 1.46 is the refractive index of fiber optic cable). The distance from New York to London is around 5575 km. So even if the fiber were in a straight line, the best latency we could expect between those two locations is 5575*(1.46/300,000)*1000*2 is about 54ms.

[notice]This is a simple calculation for guessing ideal scenarios. It is generally invalid to use it as an argument because a) fiber optic cables are rarely in a straight line, b) routers, switches and repeaters often get in the way, and c) most of these calculations are on estimates which err on the side of a smaller round trip time than a longer one.

The calculation is as follows:

$distancebetweentwocities_km * (1.46 / 300,000) * 1000 * 2

(or for you folk not upgraded to metric, $distancebetweentwocities_miles * (1.46 / 186,000) * 1000 * 2)

You take the brackets and calculate the estimated speed of light through the fiber, then multiply that by the distance between your two cities to calculate the estimated time in seconds, then multiply that by 1000 to get milliseconds, then multiply that by 2 to get your round trip time in ms.[/notice]

We can see from the trace that it takes closer to 70ms for the packet to go from New York to London, so we’re actually looking pretty good.

Back to the real results, we see in hops 13 and 15 that there is a 2% loss. Over 50 packets this is only 1, so it’s difficult to know for sure, but remembering what we said before about through vs. to, in this case it is possible that the packet lost at hop 13 was actually lost and not just dropped by the router. We also have a 24% drop at hop 14, so it’s possible that the packet lost at hop 13 was coincidental and the packet lost by 15 was actually lost at hop 14.

So there it is, interpreting MTR results. The core notes you should take away are these:

  • If you see packet loss at a hop along the route, but the loss is not carried through remaining hops, it’s more likely a result of ICMP deprioritization at that hop, it’s almost certainly not an issue of packet loss along the path.
  • The same applies to latency, if you are seeing increased latency at a single hop but the latency is not carried through the remaining hops, it’s more likely a result of ICMP deprioritization at that hop.
  • If you’re submitting an MTR report to your ISP to report an issue, make sure you get one for the return path as well (see Part One, last week’s post).


Diagnosing Internet Issues, Part One

Having worked in the support team for a Network Services Provider, it’s fairly common to see customer tickets come in complaining about packet loss or latency through/to our network. Many of these are the result of them running an MTR test to their IP and not fully understanding the results, and with a little education on how to correctly interpret an MTR report they are a little happier and generally more satisfied with the service.

More recently, however, I’ve noticed more and more people giving incorrect advice on the internet via some social communities which perpetuates the problem. There is already a wealth of knowledge on the internet about how to interpret things like ping results or MTR reports, but I’m going to present this anyway as another reference.

This post however deals with the basics of how the internet fits together from a networking standpoint, and we’ll look at some well known things, and some lesser known things.

There is an old term that just about everyone has heard: The Internet is a Series of Tubes. It’s not far from the truth, really, they’re just tubes of copper and fiber which carry electrons and light which through the magic of physics and the progression of technology have allowed us to transmit hundreds, thousands, millions of 0s and 1s across great distances in fractions of a second and send each other cat pictures and rock climbing videos.

Take the following as an example. The two squares represent two ends of a connection, say your computer and my web server. In between and all around are any number of routers at your house, your ISP, their uplinks, peers, and providers, and in turn the uplinks, peers, and providers of my server’s host, their routers, and finally the server itself:

seriesoftubes

The yellow lines represent links between the different routers, and I haven’t included their potential links outside the image to other providers. This, essentially, is what the internet looks like. Via protocols like BGP, each router is aware of what traffic it is responsible for routing (e.g. my router may be announcing 198.51.100.0/24 to the internet, through BGP my providers will also let the rest of the internet know that in order for traffic to reach 198.51.100.48 they well need to come to my router) and they also keep track of what their neighbors are announcing. This allows the internet to be fluid and dynamic in terms of IP addresses moving around between providers and so on.

So let’s say you wanted to reach my server, as you did when you opened this web page. The simplest example is the one we gravitate to: it simply uses the shortest possible path:

seriesoftubes2

The purple line represents the common “hops” between devices, and in this case the traffic passes through 6 routers on it’s way from your computer to my server, and then the same 6 hops when my server sends back the page data. In the “old days” of the internet, this was actually a pretty accurate representation of traffic flow, as there were (compared to today’s internet) only a handful of providers and only a couple of links when it came to crossing large distances, such as Washington DC to Los Angeles.

Today there are significantly more providers, and millions of links between various parts of the world. Each provider has peering agreements with each other that determine things like how much traffic can be sent across any given link, or what it costs to transfer data. As a result, we may have two providers, so if it would cost $0.10/mbps to send traffic through provider A, but cost $0.25/mbps to send it through provider B, that is an incentive for an ISP to prefer receiving traffic over either link, but avoid sending it via provider B if there are cheaper peers available.

What this means is that it’s entirely possible (and in fact, more common than not) for traffic to go out through one path and come back through a separate path:

seriesoftubes3


In this example, we still see purple for the common links, but the red shows traffic going from the left to the right, while the blue shows traffic from the right to the left. See how it took a different path? There are any number of variables that play into this, and it usually comes down to the providers preferring traffic due to capacity concerns or, more likely, cost to transmit data.

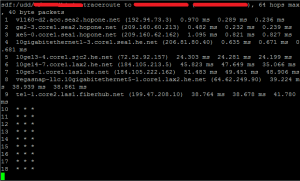
Let’s take a practical example with two traceroutes. I used a VPS in Las Vegas, NV, and a free account at sdf.org and from each one, traced the other. Here’s the trace from Vegas to SDF:

reversepathex2


And the return path:

reversepathex1


Now, it’s cut off in the screen, but I happen to know that “atlas.c …” is Cogent, so from a simple analysis we see that traffic went to SDF via Cogent, and came back via Hurricane Electric, or HE.net:

reversepath


For this reason, whenever you submit traceroutes to your ISP to report an issue, you should always include, whenever possible, traces in both directions. Having trouble reaching a friend’s FTP server? Ask them to give you the traceroute back to your network. If the issue is in transit, there is a 50/50 chance it’s on the return path, and that won’t show up in a forward trace.

The network engineers investigating your problem will thank you, because they didn’t have to ask.


Read Only Friday

It was about 2 years ago I first heard the concept of Read Only Friday. I thought it was great then, but having worked in a customer-facing role for the last year, especially in an organization that doesn’t practice ROF (and part of my customer-service role includes weekend support), the more I see the shining benefits of having a Read Only Friday Policy.

For those of you who don’t know, Read Only Friday is a simple concept. It states that if your regular staff are not going to be on duty the following day (e.g. because it’s Friday and tomorrow is Saturday, or today is December 23rd and the next two days are company holidays for Christmas), you do not perform any planned changes to your production environment.

That is to say you shouldn’t be planning network maintenance or application roll-outs for a Friday simply because if something goes wrong then, at best, someone is staying late to fix it (and that’s never fun, less so on a Friday) or at worst, someone is going to get a call and potentially spend a significant part of  their weekend resolving whatever happened.

I see the logic behind it – especially for organizations where staff availability for upgrades is low but the requirement has been specified that it won’t occur within generally accepted business hours. Personally, I still (naively) think that Sunday night or any other weeknight would work better while achieving the same goal. If anything, it may improve the quality of work being done because the one performing the maintenance is more likely to be the one getting the call the next day. Of course, you could also institute a rule that if anything breaks that could be related to any work done on Friday, the individual who did it gets the call.

Now, it doesn’t restrict you from changing production at all, because sometimes things break on a Friday that necessitate work, but these are generally unplanned and the change is in order to provide a return to operation.

I am all in for making life easier, not just on the plebs who have to talk to angry customers, but on the higher level people who inadvertently get the call to fix something that’s broken. Moreso on Christmas day, when they should be at home with their families and/or friends, celebrating the fact that they can be at home with their families and friends.

The development environment, on the other hand, is fair game.

Nagios 4 on Ubuntu 13.10

Last night I installed Nagios 4 on an Ubuntu 13.10 VM running on my VMWare ESXi machine.

I followed through the steps listed here, which worked overall:

https://raymii.org/s/tutorials/Nagios_Core_4_Installation_on_Ubuntu_12.04.html

I did run into a small number of issues which should be documented for anyone trying this on a later install of Ubuntu, but raymii isn’t allowing comments, so I can’t post them there.

1) The Apache configuration setup changed, (as it did in Debian, breaking a few things) so instead of a conf.d directory, it uses conf-available and conf-enabled, just like mods and sites. Further, the configure script doesn’t pick this up automatically, so you need to tell it where the config directory is (I told it the conf-available directory and then linked from conf-enabled, per the standard as it typically is)

2) The ‘default’ site which they tell you to disable has been renamed, you can “a2dissite 000-default” to remove the site.

3) Most critically, apache doesn’t have CGI enabled automatically. Most importantly was enabling the CGI module and reloading Apache.

Overall Nagios 4 seems to have installed correctly and is running nicely. I'll try to get my configs over from my production system and see how they run and start playing with the new features in version 4.

I’ve also installed Zabbix on another VM, I’ll be doing some more reading and seeing if I can’t duplicate at least some of the checks I have in Nagios into Zabbix and then write up a review comparing them.

Term Pronunciation

Something I’ve noticed in my time working with systems is that the vast majority of our terms are written down 90% of the time, it’s very rare that they are verbalized. This leads to interesting divisions within our community where we develop different ways to pronounce things.

One of those that seems more common is SQL. Some people term it “sequel” while others use each letter, “S, Q, L” Which one is right seems to depend on which specific SQL implementation is being referred to. In Microsoft circles, it’s Sequel Server. The popular open-source database is considered My Ess Queue Ell.

The goal of this page is list a few of the written terms, and how I tend to pronounce them. By no means are they necessarily accurate, and it really doesn’t matter so long as whoever is listening to you understands what you are saying when you speak them out load. If you say one of them differently, drop me a comment, I’d be interested to know what it is and how you say it, and possibly why.

IRC – Eye Are See. When I was in high school, I had a friend who would say it as “urk”, and his client of choice was “murk.” It took me a while to realize what he was saying, but for me it’s always been an acronym, I, R, C.

SQL – Depends how I feel, but usually again, S, Q, L. If I’m having a conversation with someone, it may vary based on what they call it just to reduce confusion. This one I’m flexible on.

/var – The name stems from the word “variable” as the contents of this directory are subject to change regularly, things like /var/log and /var/spool, but how I say it usually rhymes with “bar,” “far” or “car.” I guess it should possibly be said closer to “there” as in “there-ee-ah-bull” but I don’t care. (If we’re going by that rule, “lib” should be said as “lyb”, since it’s short for “libraries” – most people call it “lib” to rhyme with “bib” or “fib”)

/etc – This gets referred to by different names also. Some people around here call it “etsy” others call it “E, T, C”, I usually skip the debate entirely. When I do have to pronounce it, it tends to be as “etcetera” as it’s how you usually pronounce things that are written as “etc”

eth0 – The rarely spoken name of the primary network interface on common Linux, and some other Unix-based systems. My verbalization of this comes from my pronunciation of what it’s short for, ethernet or “ee-ther-net.” That said, I tend to say it as “eeeth”, to sound similar to “beef” (without the b). Others I’ve heard recently say it as “eth” to rhyme with “Beth.” I guess I just contradicted my rule on saying things based on how they look, rather than what they’re short for!

Linux – This is pretty well standard now, “linnix” is the common. When first introduced, however, it tended to be said more in line with the name of it’s creator, Linus (Ly-niss), we would say it “lie-nicks” or “lie-nucks”

Those are the ones I can think of, there may be an update to this post, or perhaps a SQL in the future.

I do want to see your comments, however, what are some tech/IT terms you see written down all the time but hear pronounced differently from time to time?

Coincidence

I’m typically not one to believe in co-incidence, but I’m also a fan of correlation not necessarily proving causation, while also not disproving it.

We run a large number of Tripplite PDU (power distribution unit) devices in customer cabinets in our facility, they are largely how we determine power usage and billing for overages in power (using SNMP cards, a private VLAN and a set of monitoring systems). It’s rare that we have issues with them, but just the other day we suddenly started getting multiple communication alerts for one PDU in particular.

I saw it and noted it, verified everything attached was online, and left it alone until I had a few minutes to go and reseat the web-card. I didn’t think about it for another hour until it tripped again, and then again, and then again. Several times it would come back online on it’s own without us going to reseat the card. There seemed to be no rhyme or reason as to why it was dropping or when. This was late on a Friday, so we decided to ride it out through the weekend and let the provisioning team know so it could be handled on Monday.

Today (Sunday) I came in and saw a few alerts for the same PDU, and then noticed one for another PDU in a different cab with the same issue. These two have very little in common, they’re the same type of PDU but they’re in different cabinets in different rows attached to two different switches. I check the alert history and notice it has done the same thing 4-5 times in the previous 72 hours. It seems like both have failing web cards but it seems odd that they would fail together, especially separated as they are. At this point, our provisioning engineer who works Sunday’s was already investigating the first one, so I added it to his notes to take a look.

To cut an even longer story short, it was determined that at some point in the past, one of the two cards had crapped itself; it was no longer showing the serial number in the web interface and it had reset it’s MAC address to “40:66:00:00:00:00.” This wasn’t a major issue, it was still responsive and everything stayed happy. Until one day (earlier this week, presumably) the other card in the other PDU did the same thing – no serial and MAC address 40:66:00:00:00:00. Now we have a MAC address conflict on the VLAN and suddenly they begin interfering with each other. Once this was determined we pulled one of the cards – the alerts have been quiet for several hours, pinging the remaining card shows no packet loss over more than 6000 pings.

The good news is that to resolve the MAC address conflict, we really only need to replace one of the two cards. For now at least.

Communication and It’s Relation to Customer Satisfaction

As systems administrators we work in an environment where everything we do provides a service of some kind. Whether it’s providing a shared hosting server to multiple users at a low cost, managing racks of servers for a client for thousands of dollars a month, or maintaining an Active Directory infrastructure for a small business to go about their day to day business selling lumber or making pipes. We have been given a set of expectations and our job is to meet those expectations.

Sometimes, however, these expectations aren’t well communicated, and this causes all kinds of problems. We had a customer on our shared platform just this week who had a problem and had done a small amount of research into what he wanted, and started addons to his existing service with us to fix it. Little did either of us realize, his solutions to the problem were being poorly communicated, so while we worked with him to provide what he has requested, it didn’t actually resolve the problem he had to begin with.

The customer was using our cPanel environment, and had been seeing SSL errors while accessing his webmail account at hisdomain.com/webmail. This is typically not an issue, and we have a valid SSL certificate if the site is accessed as server.ourdomain.com:2096 – but the customer was concerned that his encrypted connection was not being handled as securely as it should.

However, what he initially communicated to us, was that he planned to conduct business via his website and that the tax regulations of his country demanded this be done via an encrypted website, necessitating an SSL certificate. He bought a dedicated IP addon for his account and then opened a ticket to request the SSL certificate, explaining his reasoning as above.

And so we provided just that: we assigned the IP to his account, and issued an SSL certificate for his domain and installed it. After 25 pages in the ticket (many of which were a result of an error on his side which caused us to see every response he made come through 4 times), we had a long back and forth and eventually we realized that what he had asked for wasn’t even close to what he wanted.

This will inevitably lead to a position where despite our best efforts and the involvement of a large number of people scrambling over themselves to help meet the customers needs, the customer will leave the experience deeply unsatisfied and feeling that we have in some way cheated him.

Communication is the key to ensuring that our customers are satisfied, ensuring that they understand the problem, and what the solution they are buying can do to resolve that problem.

“If It Isn’t Documented, Then It Isn’t Done”

Wise words from a Senior Sysadmin that I heard today, fortunately not directed at me.

We hear this often: comment your code, document your processes. How many of us actually do it, and do it in a way that someone else can follow?

Documentation is important for many many reasons. Primarily ensuring that someone else can take over for you if required,

Friday’s are a great day for this, especially if you work in an environment that supports the idea of “read-only Friday” where any change to a production system is banned, and changes to non-production systems are not recommended. Use your time to write documentation, so that if you are sick, or take a vacation, or move on to new opportunities, you can ensure and rest easily knowing that those filling your position either temporarily or permanently are doing so without cursing your name or screwing things up unnecessarily.

And if you’re working on a new project, whether it be building out a system or developing a new tool: If it isn’t documented, then it isn’t done.

Handling Outages – A Lesson from Hostgator

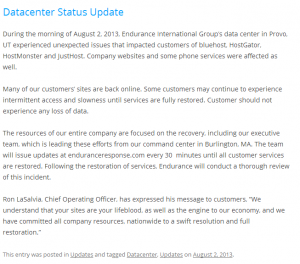
Yesterday Hostgator had a major outage in one of it’s Utah datacenters which caused a number of customers to be offline for several hours. The outage actually impacted Hostgator, Hostmonster, Justhost, Bluehost, and possibly more, but this post regards the Hostgator response specifically.

These companies all provide shared webhosting services. I am neither a client nor an employee of any of the businesses, though I do know people who are.

The company I do work for has had it’s share of outages, and I am doing what internally to help improve our own practices when outages happen, and I will consider following up on this with my manager next week to see if we can learn anything from it. What I saw during the outage, as an outsider, is interesting. There were three outlets of information provided, which we’ll analyze.

The first is the Hostgator Support Boards, their public forums where users can ask each other for help and the staff can jump in and provide assistance also. There was a thread about the outage, I’ve taken an excerpt (original):

2013-08-03_1300


The thing that stands out most is that it is really the same update over and over again, no new information is being provided to the customer. This might work just fine for brief outages, but when the initial outage notification is at 10:30am, to be providing the same details until 4pm with nothing of substance in between is unacceptable. For six hours forum users were told by this thread that “the issue is ongoing, and our staff are working to resolve it” in several forms and variations.

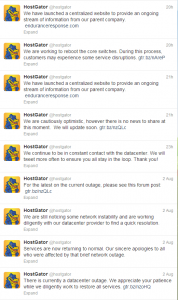
Another outlet of information was the HostGator Twitter account (here), which had the following to say (note it is in reverse, captured 1pm EDT today, Saturday):

2013-08-03_1301

Times are based on EDT:

Again, an initial report just after 9am, followed shortly by an (incorrect) report at 9:40am that things are returning to normal. At 10:45am the outage is announced and at midday users are then directed to the above forum post, which has no details worth anything to someone wondering why their site has been down for hours. Still no useful news via Twitter, until at just before 4pm they announce a new site to provide updates.

And so we reach the third source of information, found here, which had updates every half hour from 3:30pm to 6pm, when the issues were finally resolved for the day. This is the only source where useful data for the technically minded could be found.


2013-08-03_1302


It turns out there were issues with both core switches at the facility which brought the entire network down. Not only did it take 8-9 hours to fix, it also took 6 hours for the company to provide any useful information as to what the problem was and what was being done to fix it.

Providers should look at this stream of communication and consider whether they would find it acceptable, and review how they handle their own outages. I have been in this situation as a customer, albeit with a different provider. If there is an outage for 10 minutes, I can be quickly placated with a “there is an issue, we’re working on it.” If the outage extends anywhere beyond about an hour, I want to know what is wrong and what is being done to fix it. Not because I want inside information, I want you to demonstrate that you are competent to find and fix the problem – this is what gives me confidence to continue using your service after the issue is fixed. And if your service is down beyond 2 or 3 hours, I am going to expect new useful updates at least hourly, ideally more often, so that I can follow the progression of solving the problem.

For me as a customer, it isn’t that your service went down, I understand things break. It is more important that you provide honest and useful details on why it is down and when you expect to have it fixed, even if these things are subject to change.